Dashboard
The Dashboard contains visualized data on the current state of archived materials at the Blinken OSA. The page also includes a simplified search engine in which you can narrow the data sets for fonds, subfonds, and series.
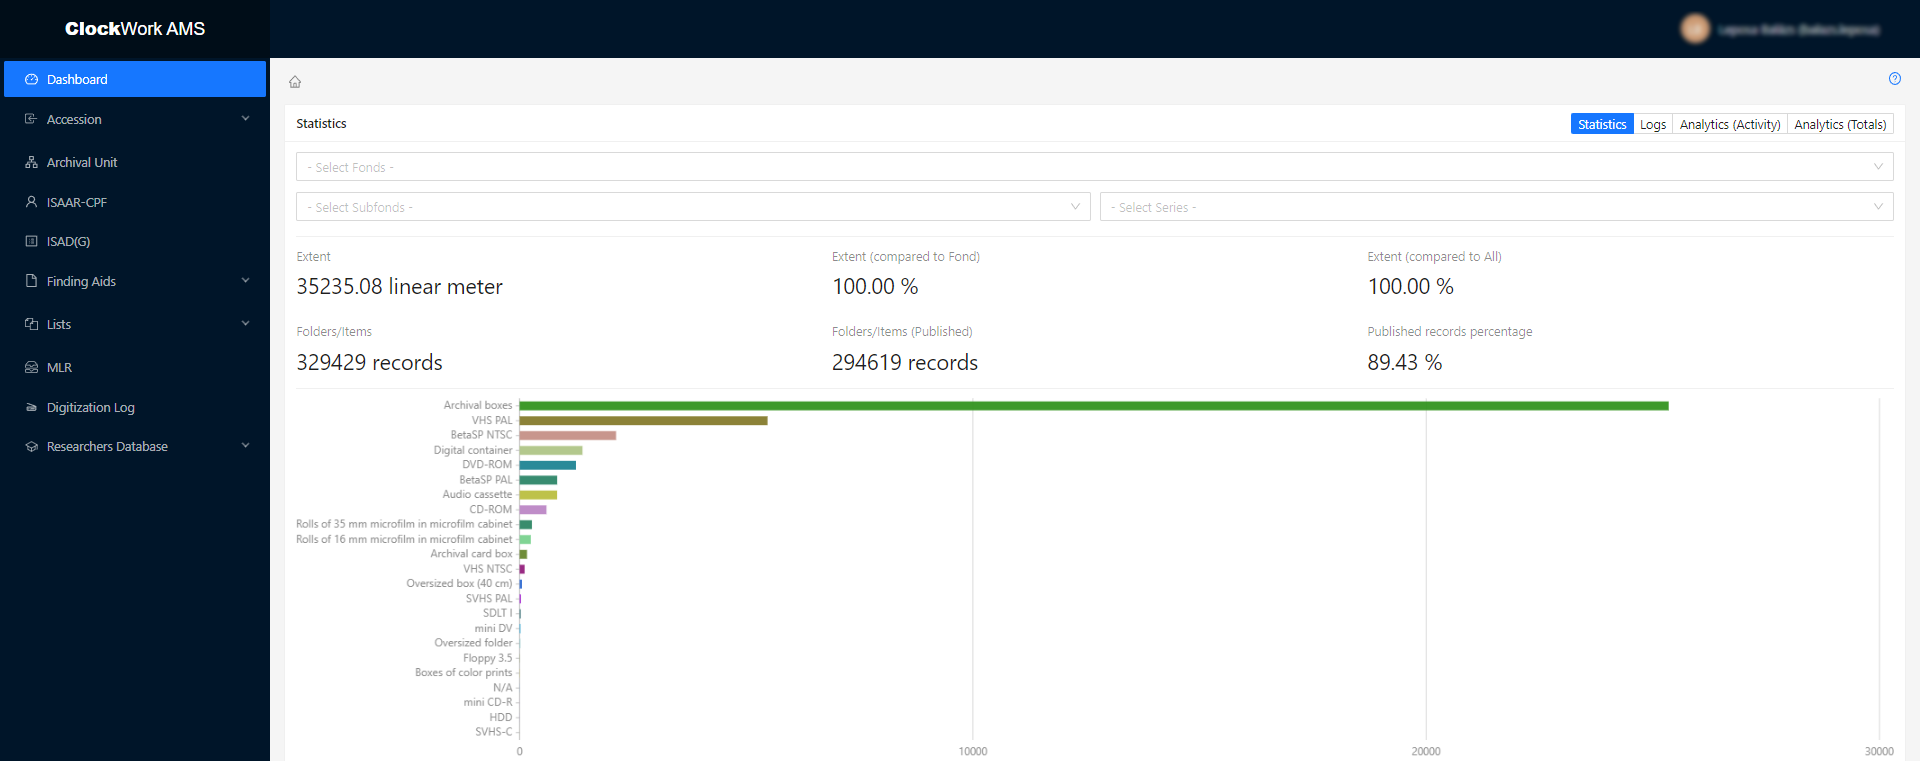
In the upper right of the screen, four buttons can be clicked:
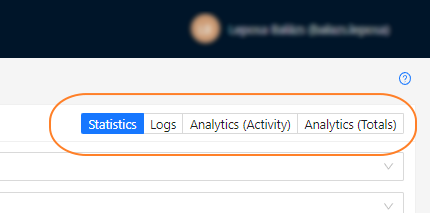
- Statistics (to see the visualized data of AMS by linear meters) (this screen)
- Logs (to see the timeline of submitted changes to the whole system.)
- Analytics (Activity) (to see the visualization of overall activities of AMS in the last three years)
- Analytics (Totals) (to see the visualization of added activities of the Ams in the past three years.)

